REI Weekly: Update
Current Chart and comment:
Trade still in place, although there has been little movement. Looking at the chart it seems to be forming a strong base still holding on those converging support levels. Looking at the indicators they are still solidly grouped in the buy zone. Targets still remain.

First Chart and comment:

JSE REI Weekly chart
Another share that is seriously oversold! Looking at the weekly chart the stochastics are heavily grouped in the buy zone and the RSI is showing a bullish cross with its moving average. The share price its self has also pulled back to the significant double support intersection level at R26.50. A close above the 200MA will confirm this bullish sentiment. Target 1 is to the 200MA level at R28.07 above this and target 2 is R29.15 and target 3 is R30.92
SOL DAILY: Update
Current Chart and comment:
SOL trade reaching the first target and still looking good. Indicators showing that the share is not overbought just yet. Will take some profit but will hold out for the next target level.

First Chart and comment:

SOL Daily Chart
SOL is looking very bullish with a pull back to the weekly support level that has been in place since August 2014. Both the Daily and weekly charts have the indicators in the buy zone signaling that the share is highly oversold. Targets are shown in the graph and will remain unless there is a weekly close below the support level of R347. The current PE is 8.64 with a forward P/E of 9.13.
MTN Daily: Update
Previous Chart and comment:

JSE MTN Weekly Chart
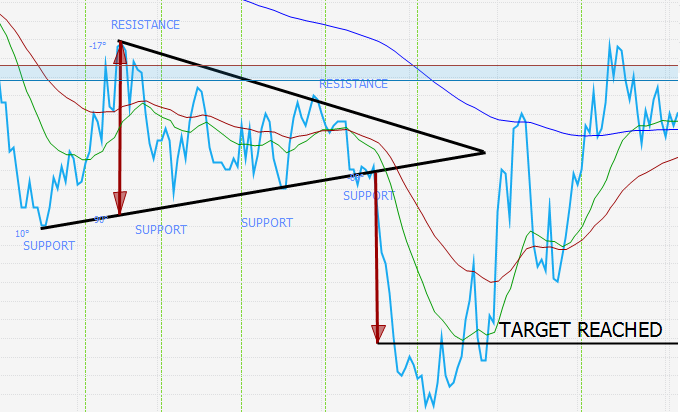
The weekly share price broke through the bear flag formation and has now reached its target level using the flag width method. Looking at the weekly indicators the share price is also looking very oversold with the weekly stochastics strongly grouped in the buy zone. Looking at the RSI it is evident that there is a buy divergence on the RSI bottoms. Above the level of R105 and the share is looking bullish.

JSE MTN Weekly Chart
The weekly share price broke through the bear flag formation and has now reached its target level using the flag width method. Looking at the weekly indicators the share price is also looking very oversold with the weekly stochastics strongly grouped in the buy zone. Looking at the RSI it is evident that there is a buy divergence on the RSI bottoms. Above the level of R105 and the share is looking bullish.
UPDATE:

Sentiment still remaining bullish, next short term leg is 127.40. Stochastics solidly grouped in the buy zone and bullish cross on the RSI.

Sentiment still remaining bullish, next short term leg is 127.40. Stochastics solidly grouped in the buy zone and bullish cross on the RSI.
GND Weekly: Update
Previous Chart and comment:

JSE GND Weekly chart
Potentially a very strong looking chart. The weekly share price is now testing the strong resistance level that has been in place since March 2015. Looking at the indicators it seems like the writing has been on the wall with this share, with a very strong buy divergence on the RSI tops and bottoms. Looking at the stochastics it paints a similar picture with the stochastics showing bullish intersections. A weekly close above the resistance level of R12.88 will target the levels shown in the graph. The share is also trading at roughly 56% off its all time high.
UPDATE:

GND Weekly just short of the first target.

GND Weekly just short of the first target.
NPN Weekly: Update
Previous Chart and comment:

JSE NPN Weekly chart
NPN is another share that has seen a significant pull back to its ultra long term trend line. The daily and weekly charts are very oversold with a weekly bullish intersection on the fast stochastic. Will look to go long and remain bullish above a weekly close of R1987. The last 2 candle sticks also depict a classic reversal formation . Targets are as seen in the graph.
UPDATE:

Long position is still intact with the weekly support level still holding. Will add to the positive sentiment with a break above the 50MA

Long position is still intact with the weekly support level still holding. Will add to the positive sentiment with a break above the 50MA
REI Weekly: Update
Previous Chart and comment:
JSE REI Weekly chart
Another share that is seriously oversold! Looking at the weekly chart the stochastics are heavily grouped in the buy zone and the RSI is showing a bullish cross with its moving average. The share price its self has also pulled back to the significant double support intersection level at R26.50. A close above the 200MA will confirm this bullish sentiment. Target 1 is to the 200MA level at R28.07 above this and target 2 is R29.15 and target 3 is R30.92
UPDATE:

All target level are still intact as the support level is still holding. The share is now extremely oversold and with Fridays Fitch rating announcement rand hedge stocks might see some added bullish sentiment.

All target level are still intact as the support level is still holding. The share is now extremely oversold and with Fridays Fitch rating announcement rand hedge stocks might see some added bullish sentiment.
SOL DAILY: Update
Previous Chart and comment:
SOL Daily Chart
SOL is looking very bullish with a pull back to the weekly support level that has been in place since August 2014. Both the Daily and weekly charts have the indicators in the buy zone signaling that the share is highly oversold. Targets are shown in the graph and will remain unless there is a weekly close below the support level of R347. The current PE is 8.64 with a forward P/E of 9.13.
UPDATE:

Sentiment still remains bullish as share price is still above the resistance level.

Sentiment still remains bullish as share price is still above the resistance level.
JSE COH

COH Daily chart
After a significant rally to test the 61.8% retracement line the share price tested this line as a resistance and failed to break through. The share is looking to pull back to the support trend line with a target level of R44.94. Looking at the indicators they are confirming this sentiment with the stochastics moving from being grouped in the sell zone to approaching the buy zone.
JSE SOL
SOL Daily Chart
SOL is looking very bullish with a pull back to the weekly support level that has been in place since August 2014. Both the Daily and weekly charts have the indicators in the buy zone signaling that the share is highly oversold. Targets are shown in the graph and will remain unless there is a weekly close below the support level of R347. The current PE is 8.64 with a forward P/E of 9.13.